How to Query Search Console CSV Exports with SQL | Python, BigQuery, and Browser Tools
Search Console's UI caps CSV exports at 1,000 rows per tab. The moment you try to compare month-over-month trends or run a cross-dimensional analysis, you hit the ceiling.
This article covers three ways to run SQL queries on Search Console CSV data: using Python to query local CSV files directly, using BigQuery for full-dataset analysis, and using a browser-based tool for no-code pivot tables.
3 Ways to Query Search Console CSVs with SQL
| Method | Setup | Cost | Row limit | SQL required | Best for |
|---|---|---|---|---|---|
| Python (DuckDB) | pip install duckdb only | Free | CSV file size | Yes | Quick analysis on local CSVs |
| BigQuery | GCP project + connector setup | Pay-per-query (free tier available) | No limit | Yes | Full dataset analysis, GA4 integration |
| Browser tool | None (open in browser) | Varies by tool | CSV file size | No | GUI-based pivot tables without writing SQL |
Start with Python if you want the fastest path to a working query.
Query Search Console CSVs with Python and DuckDB (Ease ★★★)
DuckDB lets you run SQL directly on CSV files without setting up a database or designing a schema. It's the fastest way to go from a downloaded CSV to an actionable result.
Install DuckDB and Load Your First CSV
pip install duckdb pandas
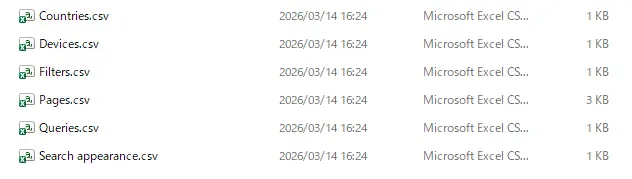
When you export data from Search Console and unzip the file, you'll find these 6 CSV files:
| File | Content | Use Case |
|---|---|---|
Queries.csv | Performance by search query | Keyword ranking and CTR analysis |
Pages.csv | Performance by page URL | Clicks and impressions per page |
Countries.csv | Performance by country | Geographic traffic analysis |
Devices.csv | Performance by device type | Mobile vs. desktop comparison |
Dates.csv | Performance by date | Trend analysis over time |
SearchAppearance.csv | Performance by search feature | Rich snippet and AMP analysis |
Each CSV shares the same column structure: a dimension column (Top queries, Top pages, etc.), plus Clicks, Impressions, CTR, and Position.
The basic pattern for running a query:
import duckdb

result = duckdb.sql("""
    SELECT *
    FROM read_csv_auto('Queries.csv')
    LIMIT 10
""")

print(result)
read_csv_auto() infers headers and column types automatically. Search Console exports CSVs as UTF-8 with BOM — DuckDB handles BOM transparently, so you won't run into encoding errors.
Copy-Paste Query Library for Search Console Analysis
Top queries by click volume
import duckdb

df = duckdb.sql("""
    SELECT
        "Top queries" AS query,
        Clicks        AS clicks,
        Impressions   AS impressions,
        CTR           AS ctr,
        Position      AS avg_position
    FROM read_csv_auto('Queries.csv')
    ORDER BY Clicks DESC
    LIMIT 50
""").df()

print(df)
Appending .df() returns a pandas DataFrame, which makes it easy to export to Excel or feed into a chart.
CTR improvement candidates — high impressions, low click-through rate
This query surfaces keywords where you're showing up in search but not getting clicks — the highest-leverage targets for title and meta description improvements.
import duckdb

df = duckdb.sql("""
    SELECT
        "Top queries" AS query,
        Clicks        AS clicks,
        Impressions   AS impressions,
        CTR           AS ctr,
        Position      AS avg_position
    FROM read_csv_auto('Queries.csv')
    WHERE Impressions >= 100
      AND CTR < 0.02
    ORDER BY Impressions DESC
""").df()

print(df.to_string(index=False))
The thresholds (100 impressions, 2% CTR) are starting points — adjust them based on your site's traffic volume.
Page performance grouped by directory
Grouping URLs by directory gives you a content-category view of performance without manually tagging every URL.
import duckdb

df = duckdb.sql("""
    SELECT
        regexp_extract("Top pages", '^https?://[^/]+(/[^/]+/)', 1) AS directory,
        SUM(Clicks)      AS total_clicks,
        SUM(Impressions) AS total_impressions,
        ROUND(SUM(Clicks) * 1.0 / SUM(Impressions), 4) AS avg_ctr
    FROM read_csv_auto('Pages.csv')
    WHERE regexp_extract("Top pages", '^https?://[^/]+(/[^/]+/)', 1) IS NOT NULL
    GROUP BY directory
    ORDER BY total_clicks DESC
""").df()

print(df)
Note: This regex matches URLs with a trailing slash on the first path segment — https://example.com/blog/ matches, but https://example.com/page (no trailing slash) does not and is excluded by the IS NOT NULL filter. Adjust the pattern to match your site's URL structure.
Merge Monthly CSVs for Month-over-Month Comparison
If you download Search Console CSVs monthly, you can stack them with UNION ALL and pivot into a side-by-side comparison.
This assumes files are organized into month-named directories: 2026-01/Queries.csv, 2026-02/Queries.csv, and so on.
import duckdb

df = duckdb.sql("""
    WITH monthly AS (
        SELECT '2026-01' AS month, *
        FROM read_csv_auto('2026-01/Queries.csv')
        UNION ALL
        SELECT '2026-02' AS month, *
        FROM read_csv_auto('2026-02/Queries.csv')
    )
    SELECT
        "Top queries" AS query,
        SUM(CASE WHEN month = '2026-01' THEN Clicks ELSE 0 END) AS clicks_jan,
        SUM(CASE WHEN month = '2026-02' THEN Clicks ELSE 0 END) AS clicks_feb,
        SUM(CASE WHEN month = '2026-02' THEN Clicks ELSE 0 END)
          - SUM(CASE WHEN month = '2026-01' THEN Clicks ELSE 0 END) AS diff
    FROM monthly
    GROUP BY "Top queries"
    ORDER BY diff DESC
    LIMIT 30
""").df()

print(df)
The result shows keywords ranked by the largest click increase. Flip to ORDER BY diff ASC to find the sharpest declines.
Load all files at once with a glob pattern
import duckdb

df = duckdb.sql("""
    SELECT *
    FROM read_csv_auto('monthly/Queries_*.csv', filename=true)
    LIMIT 10
""").df()

print(df)
filename=true adds a filename column so you can tell which file each row came from. Since this approach doesn't let you derive the month from the SQL alone, make sure month information is embedded in the filenames.
Analyze Search Console Data in BigQuery (Ease ★☆☆)
The 1,000-row cap is a UI limitation, not a data limitation. Google's bulk data export pushes the complete Search Console dataset into BigQuery daily — no row truncation.
Set Up the Bulk Export
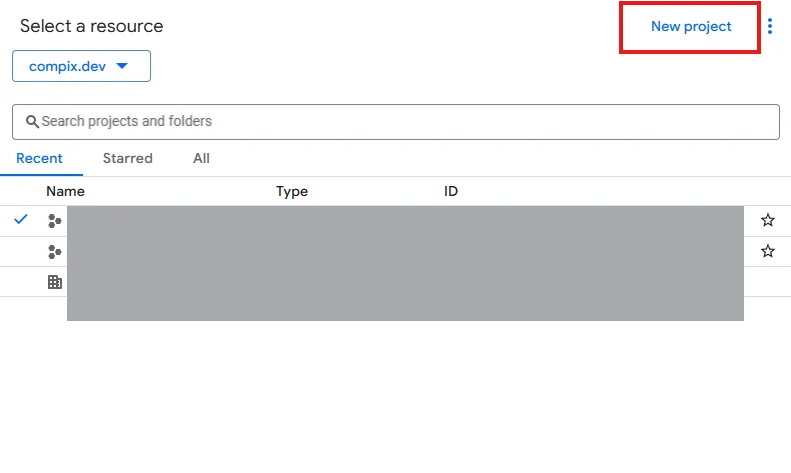
- Create or select a project in Google Cloud Console
-
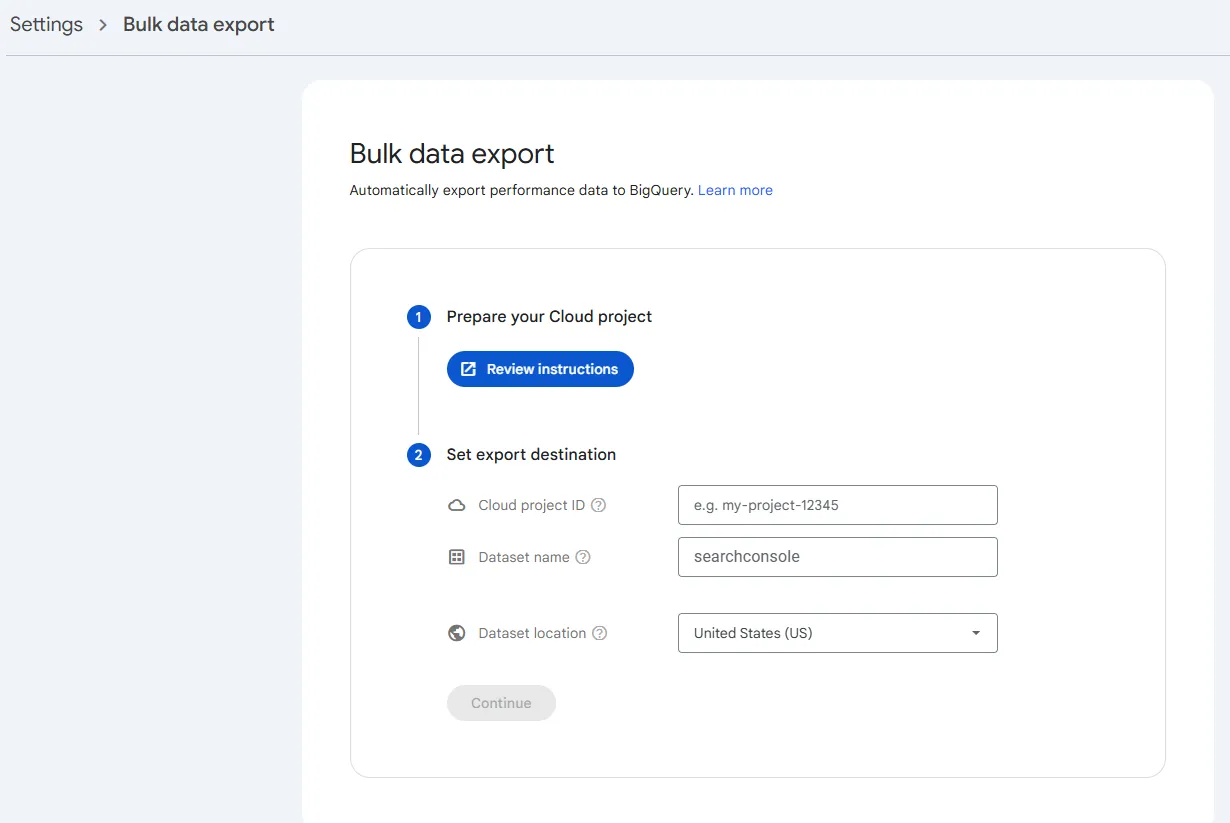
In Search Console, go to Settings → Bulk data export
-
Select your BigQuery project and specify a dataset name
-
Click Start export
The first data load takes approximately 48 hours. After that, data accumulates automatically on a daily schedule.
Two tables are created in your BigQuery dataset:
searchdata_site_impression— site-level search datasearchdata_url_impression— URL-level search data
BigQuery SQL Samples for Search Console
The queries below are BigQuery-specific. SAFE_DIVIDE is a BigQuery built-in that handles division by zero gracefully — it doesn't exist in DuckDB. If you need equivalent logic in DuckDB, use CASE WHEN SUM(impressions) = 0 THEN 0 ELSE SUM(clicks) * 1.0 / SUM(impressions) END.
Query performance summary
-- BigQuery only (SAFE_DIVIDE is a BigQuery-specific function)
SELECT
    query,
    SUM(clicks)       AS total_clicks,
    SUM(impressions)  AS total_impressions,
    ROUND(SAFE_DIVIDE(SUM(clicks), SUM(impressions)), 4) AS ctr,
    ROUND(SUM(impressions * position) / SUM(impressions), 1) AS weighted_avg_position
FROM
    `your-project.searchconsole.searchdata_site_impression`
WHERE
    data_date BETWEEN '2026-02-01' AND '2026-02-28'
    AND query IS NOT NULL  -- exclude anonymized queries
GROUP BY
    query
ORDER BY
    total_clicks DESC
LIMIT 100
query IS NOT NULL filters out anonymized queries. Remove this line if you want the totals to include traffic from queries Google has hidden for privacy reasons.
Average position uses impression-weighted averaging rather than a simple mean. A long-tail keyword with one impression and a position of 40 should carry far less weight than a head term with 10,000 impressions — simple averaging obscures this.
Device × country cross-tab
Search Console's UI doesn't let you filter by device and country simultaneously. BigQuery does.
-- BigQuery only
SELECT
    device,
    country,
    SUM(clicks)      AS total_clicks,
    SUM(impressions) AS total_impressions
FROM
    `your-project.searchconsole.searchdata_site_impression`
WHERE
    data_date BETWEEN '2026-02-01' AND '2026-02-28'
GROUP BY
    device, country
ORDER BY
    total_clicks DESC
Keeping BigQuery Costs Under Control
BigQuery charges based on bytes scanned per query (as of this writing, the first 1 TB per month is free — check the Google Cloud pricing page for current rates). Three habits that reduce cost significantly:
| Strategy | Impact | Implementation |
|---|---|---|
Avoid SELECT * | Reduces scanned data by 80%+ | Name only needed columns (e.g., SELECT query, clicks, impressions) |
Filter on data_date | Limits scan to relevant partitions | Use WHERE with date range (table is date-partitioned) |
| Estimate before execution | Prevents unexpected costs | Check top-right estimate in editor; revise if unexpectedly large |
Analyze Search Console CSVs in the Browser Without SQL (Ease ★★★)
If SQL isn't an option — or you need results in five minutes without a dev environment — browser-based CSV analysis tools let you upload a CSV and build pivot tables through a point-and-click interface.
How Browser-Based CSV Tools Work
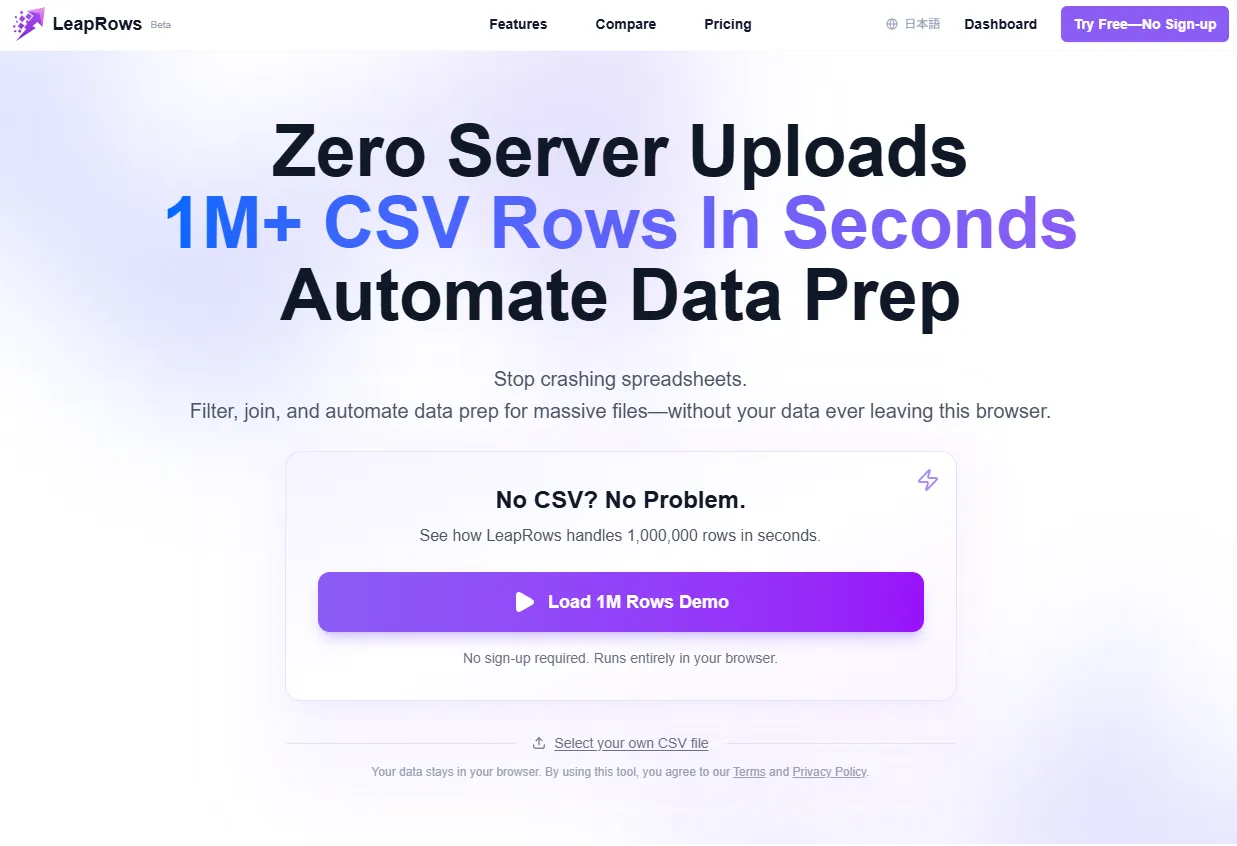
Tools like LeapRows (disclosure: built by the author) process files locally in the browser using WebAssembly. No data is sent to a server — relevant when you're handling client data or anything under an NDA.
The workflow:
- Open the tool and upload your Search Console CSV
- In the analysis view, set rows, columns, and values for your pivot table (e.g., rows = query, values = clicks)
- Apply filters to narrow the dataset (e.g., impressions ≥ 100)
- Download the result as CSV or Excel
Verify that any tool you use meets these criteria before routing sensitive data through it: browser-only processing (no server upload), UTF-8 encoding support, and the ability to handle files with tens of thousands of rows.
Get More Than 1,000 Rows with Search Analytics for Sheets
The Google Sheets add-on "Search Analytics for Sheets" pulls data directly from the Search Console API, bypassing the 1,000-row CSV export limit. The free plan supports up to 25,000 rows per request; paid plans handle 100,000+ rows. Check the add-on's documentation for current limits.
Setup:
- Open a Google Sheet
- Go to Extensions → Add-ons → Get add-ons
- Search for Search Analytics for Sheets and install it
- Authorize with the Google account that has Search Console access
Use the sidebar to select your site, date range, and search type, then click Request Data to pull results into the sheet.
The Backups tab lets you schedule daily or monthly automatic pulls. Export the accumulated data to CSV and feed it into the Python scripts above for a repeatable monthly workflow.
3 Data Quirks to Know Before You Query
Search Console's CSV data has structural limitations that aren't obvious until they distort your results.
Anonymized Queries — CSV totals don't add up
Google anonymizes and omits a portion of search queries for privacy reasons. The sum of clicks across all rows in Queries.csv will not match the total in Dates.csv. For some sites, 50–80% of query-level data is missing.
The fix: treat Dates.csv as the source of truth for totals. Query-level data is "the visible portion of the whole" — useful for identifying patterns, but not for reporting aggregate traffic numbers. Always use Dates.csv totals in executive dashboards or KPI reports.
The 1,000-Row Cap — long-tail data disappears
The CSV export is truncated at 1,000 rows per tab (queries, pages, countries, devices, dates). The larger the site, the more long-tail keywords and individual page data fall off the edge.
If you need full coverage:
| Method | Max Rows | Setup | Automation |
|---|---|---|---|
| Search Analytics for Sheets | 25,000 (free) / 100K+ (paid) | Add-on install | ○ Monthly scheduling |
| Search Console API | Unlimited | Coding required | ○ Script automation |
| BigQuery bulk export | Complete data | GCP setup | ○ Daily auto-sync |
Character Encoding — Excel mangles UTF-8 CSVs on Windows
Search Console exports UTF-8. On Windows, double-clicking the CSV in File Explorer opens it in Excel with auto-detection, which often misreads UTF-8 — producing garbled Japanese, Korean, or other non-ASCII characters.
| Environment/Method | Garbling | Steps |
|---|---|---|
| Excel 2019+ (Windows) | ◎ Avoidable | Data → From Text/CSV → confirm UTF-8 |
| Direct double-click | × Garbled text | Not recommended |
| Python DuckDB/pandas | ◎ Auto-detected | UTF-8 recognized automatically |
Automate Monthly Reporting (Ease ★★☆)
One-off queries are useful. Recurring reports that run themselves are better.
Connect Looker Studio Directly to Search Console
Looker Studio includes a native Search Console connector. Once you build a dashboard, it reflects fresh data on each visit (though caching can introduce some lag for the most recent days).
- Open Looker Studio and create a new report
- Select Search Console as the data source
- Choose your site and either Site Impression or URL Impression
- Add charts and tables
One caveat: Looker Studio's Search Console connector has its own row limit (as of this writing, around 50,000 rows for page × query combinations). For large sites, use BigQuery as the data source instead — it removes the row ceiling entirely and gives you more control over aggregation logic.
Schedule a Python Script for Monthly Pulls
For teams that want to fully automate the download-and-analyze cycle, the Search Console API combined with a Python script is the most flexible option.
The general approach: authenticate with google-auth and google-api-python-client, call searchAnalytics().query() to retrieve data, save the results to CSV, then run your DuckDB queries on the output. Schedule the script with cron (Linux/Mac) or Task Scheduler (Windows) to run monthly without any manual steps.
For a complete implementation, refer to Google's official Search Console API documentation.
Summary
Three ways to query Search Console CSV data, ranked by ease of setup:
- Python (DuckDB): one
pip installand you're running SQL on local CSVs. Results come back as pandas DataFrames. Start here - Browser tools: no SQL, no setup. Upload a CSV and build pivot tables in a GUI. Use a browser-only tool (LeapRows — disclosure: built by the author — is one option) so sensitive data never leaves your machine. Verify the tool meets your requirements before use
- BigQuery: eliminates the 1,000-row cap entirely and enables joins with GA4 and other data sources. Higher setup cost, but the right choice for large sites or teams that need automated daily reporting
Three things to know before you trust your query results:
- Anonymized queries:
Queries.csvclick totals will be lower thanDates.csvtotals — useDates.csvfor aggregate reporting - 1,000-row truncation: long-tail keywords don't appear in CSV exports. Use Search Analytics for Sheets, the API, or BigQuery for complete data
- UTF-8 encoding: open CSVs through Excel's Data tab, not by double-clicking. Python handles it automatically